

What does the ETH chart tell us?
Let's see.

The ETH chart is similar to a puzzle that requires time, discipline and dedication to be able to fit new pieces into it. I will tell you where I am in this quest.
First things first, some context. The monthly timeframe has been chosen to see the bigger picture. I am using use 3 parameters : the price action in Japanese candlesticks, the total supply of ETH (120.2m as reference) and the full diluted valuation.
ETH/USDT on Binance doesn't have a full history and I know there is an index chart but I choose it because what happened long before 2017 doesn't matter much in this article due to relatively low valuations except for one event. Also, Binance and Tether have made it to the top of the volumes so this makes sense.
Valuations, pattern and key levels
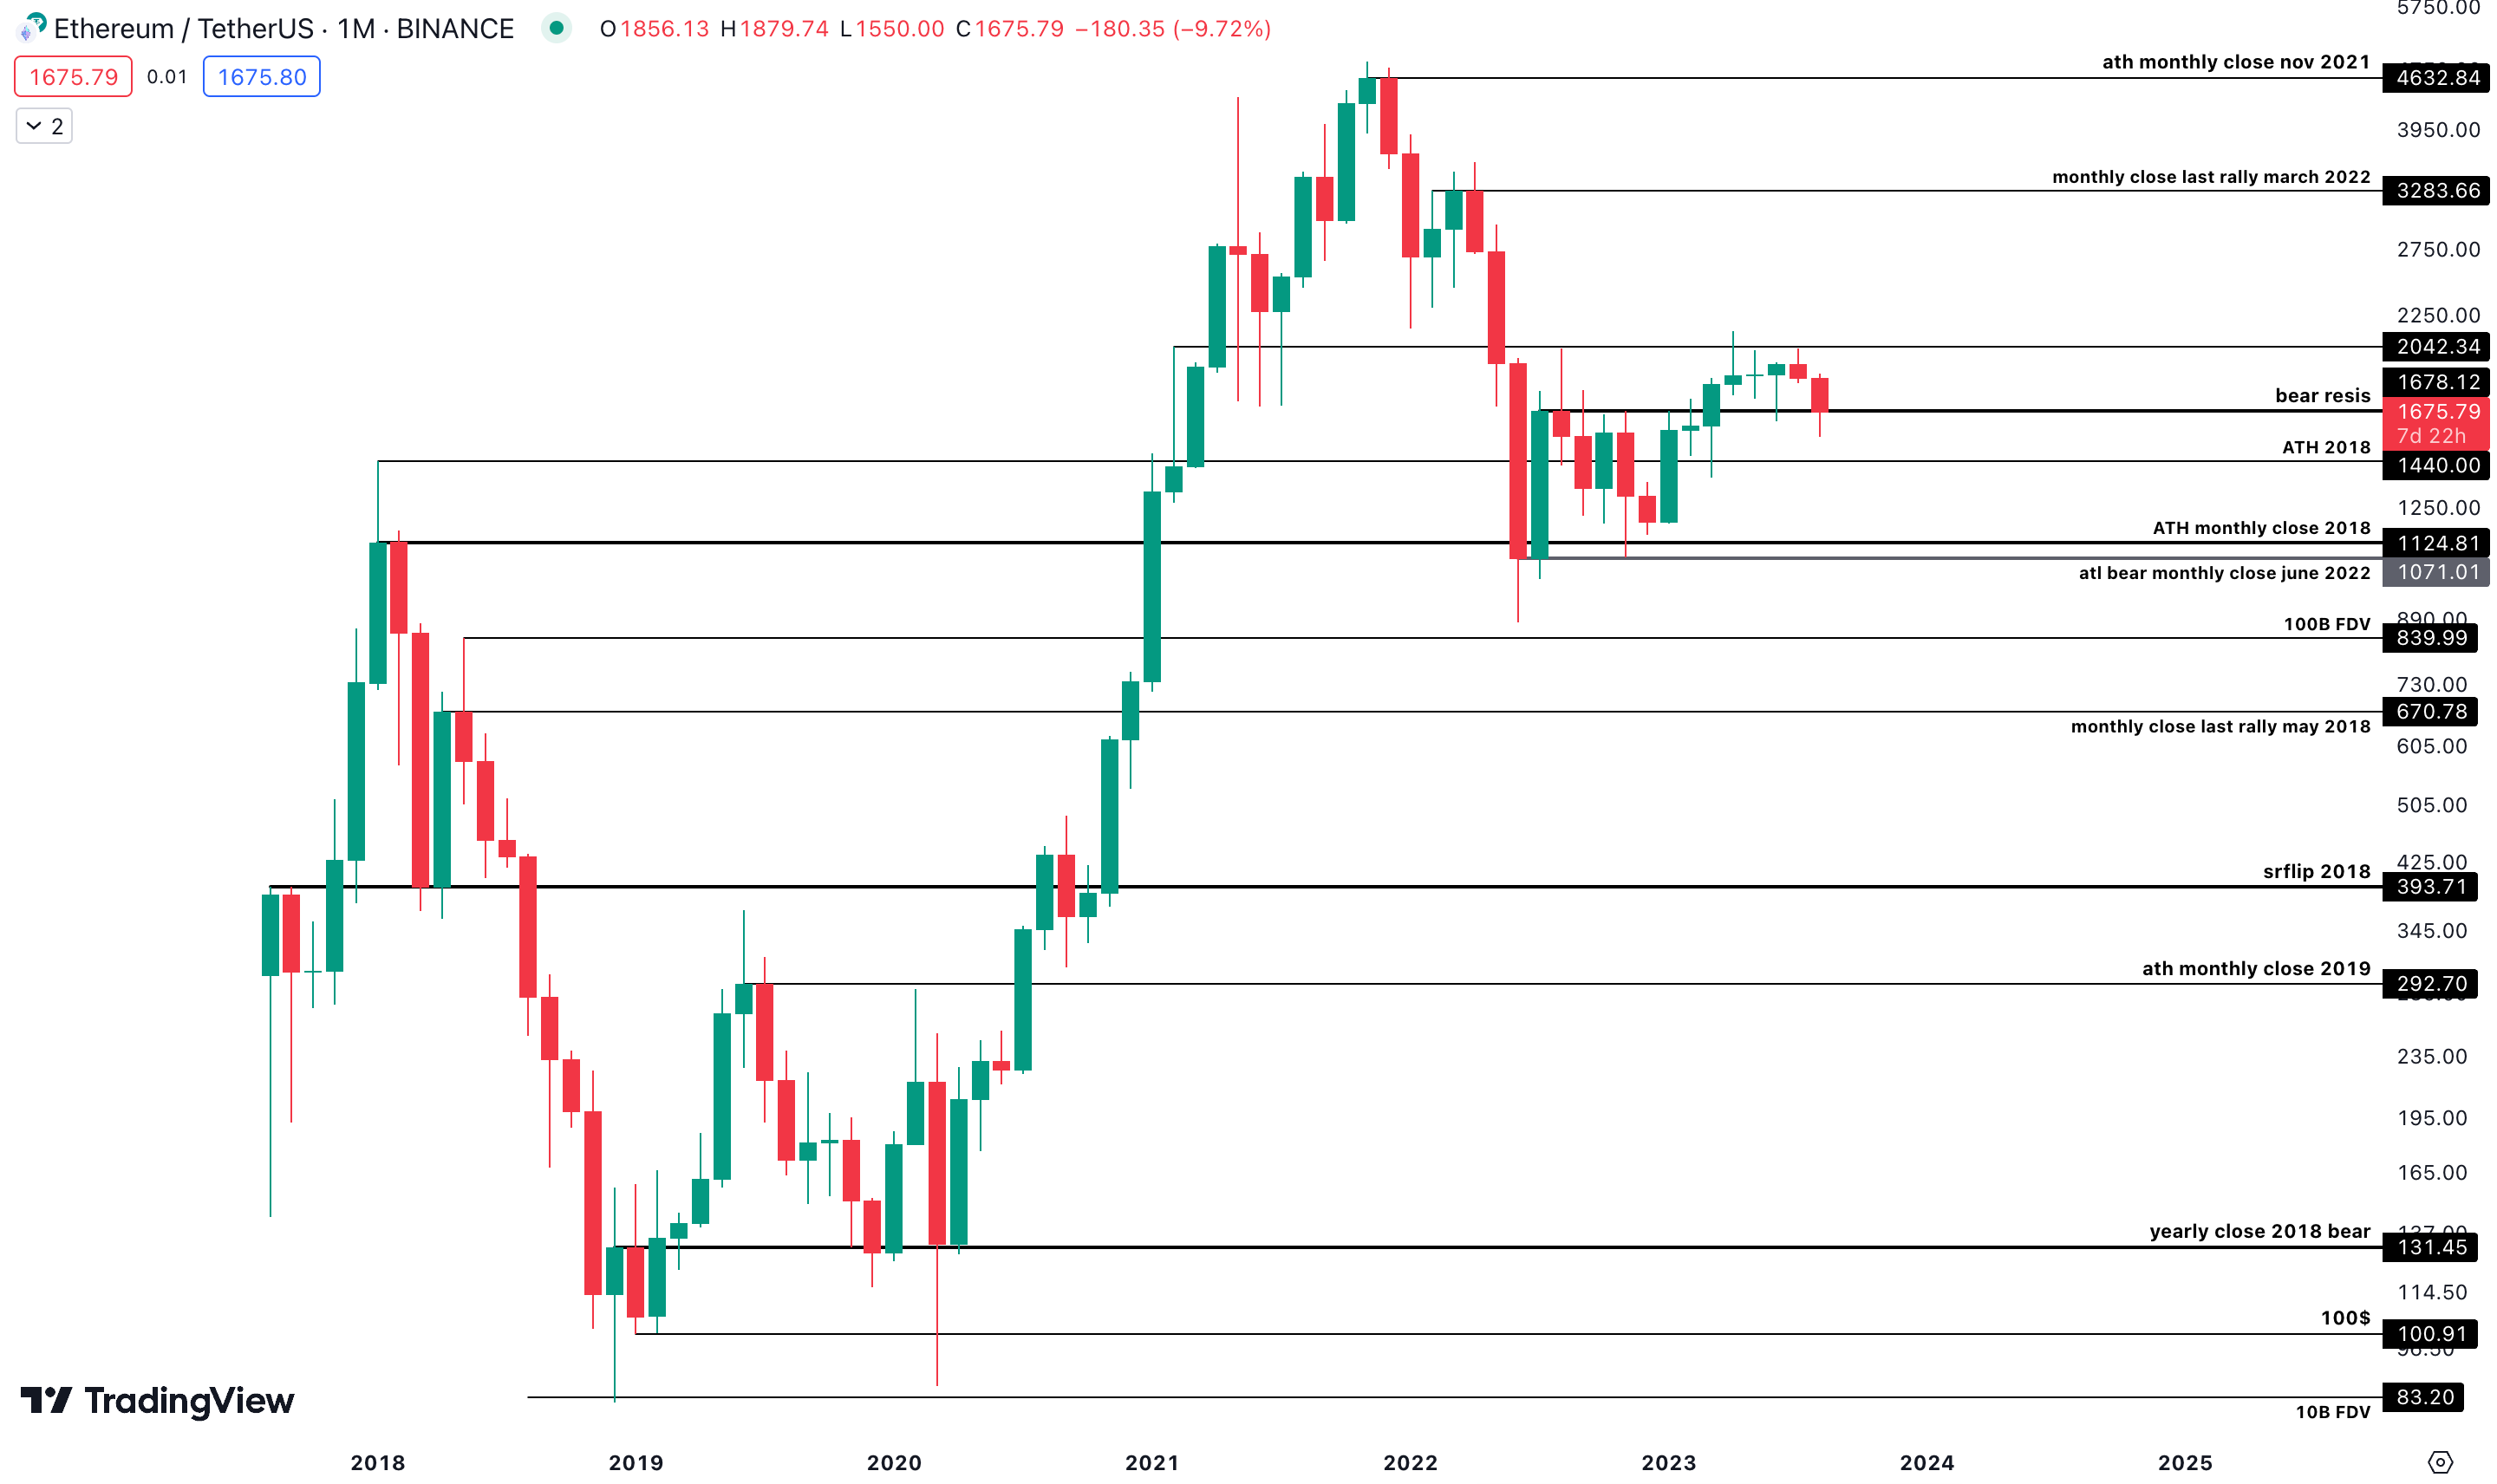
The market has agreed on valuations for ETH twice in the history of this chart. First time was in Q1 2019 and Q1 2020 when a double bottom pattern formed at $10B FDV or 83$ per ETH. The second time was not so long, in Q2 2022 and Q4 2022 when the market developed another double bottom around 850-1050$ ETH with a $100-130B FDV.
Four years later, ETH is priced at a valuation nearly 10 times higher. The same valuation rejected in 2018 before ETH was sent to Valhalla.
The 2019-2020 double bottom is clearly visible on the chart, the second leg was formed one year after the first leg but in two times due to the the covid crash. Everything happened faster in the 2022 bottom. The neckline has been reached only one month after the start of the first leg in July 2022. The second leg happened 5 months after the first. Was this a potential front running when macro cleared a little in the end of Q4 2022?
The 2022 bottom is reinforced by the validation of a pullback on the area of the 2018 ATH monthly close which turned it into strong support.
Besides that, I don’t see much difference between the two, except that the 2022 bottom showed that the market is more sophisticated and was less liquid regarding to its size at this moment. Concerning the important levels to keep an eye on, the impact of the neckline's double bottom determined by the monthly close of the local top is real. The rejection during the second leg in 2020 before the crash covid confirmed you this. I would love to talk to CT historians to know exactly what happened in Q2 2019 for ETH to top at $300.
Bis repetita when the first leg topped in August 2023 causing a violent rejection. Both times during patterns constructions, these necklines were firstly retested by a wick during the expansion of the second legs (Feb 20 and Jan 23) before funnily getting obliterated few months later (July 20 and March 23). I won't say that history repeats itself because treasuries yield is closer to 5% than 0% right now. People tell that this reduces so much the potential firepower so let’s see. Remember that the chart is only the representation of market participants' beliefs and uncertainties and they don't seem to have really changed.
All this provides crucial information on the main supports and resistances.
Supports : 840-850$ (I'm not getting lower deliberately) // 1000-1100$
Resistances : 1688-1750$ // 1933$ // 2040-2150$ // 3300$
As of now, the fly in the ointment is that the price is not supposed to break a neckline once it get through it. It will broke the pattern and could reverse the trend unless this is a fake breakout. So, we’re likely gonna broke something “huge” if we close below $1680 two months in a row with decent volumes engaged and long down wicks. This level is very important and closing this month above will be our next test.
The allure of testing the 2018 ex-ATH at $1440 will increase in proportion to the time the price stays below $1680. $1440 would be the false breakout limit. Make a monthly low below that of March ($1370) would make little sense now that we've had a sell-off wave and would therefore be an area of interest if no serious bad news correlates to this theoretical price action.
Regarding September, a dip around $1450-1500 (-9 and -12% from current price) before closing the month back above $1680 with a green doji would be very bullish in my view. This requires an August monthly close not too far from the current resistance.
Up only from there seems difficult without anything relevant happening (I hear people shouting ETH future ETFs and EIP 4844 in the back but it’s not enough). Nevertheless, it should not be excluded because it is one of ETH’s fundamental value.
The crab market we lived in seems to be over now that people have lost and won a lot of money in the last move.
If there is one thing about the last monthly candles, it’s that they didn’t teach us a lot about ETH’s future behavior. No pattern in formation, low engagement. The great indecision of the market resulted in new record lows in volatility. Then the volatility came back. Always easy to say afterwards but the selloff was likely, the longer the price stays below a important resistance, higher the chances it will retest the real area of interest, not the one determined by short terms market participants who want to trade a range to make short term profit.
I will just remember that the price didn’t have a murderous bearish urge by trading for 3 months relatively high between $1680 and $2150. So it shouldn’t trade for long around $1680 as front running this level would make sense to have the insurance that you’re loaded at the new support. If enough big players think like that…
Given that there isn't much playoff to break other than the $1070 support, people might find a way to justify that a triple bottom would be in play even if we break everything we've built in 2023 and end around $1070.
Otherwise consolidation is okay but if it is done in apathy and not concealed accumulation, it will lead to a way down as you need new buyers with size, and new buyers stepped in when the price consolidated on support after a big dump.
Is $1680 low enough for them to flip the ex bear resistance into a new support? It should be. So bottom is in? Yes I think so but as I said prices can go lower on a low timeframe without redefining the local bottom.
On the bigger picture the main trend is immaculate. Long and strong is the adage.
Main trend
The main trend is simply what takes the price in one direction, a simple idea shared by the majority of market participants that guides their behavior. Exactly like an inception. The conviction of this idea will be challenged by many but not enough, while the fulfillment of expectations will feed it.
For ETH, the main trend is based on two major foundations, the first being that Ethereum provides the infrastructure necessary to recreate a new financial world. The other is obviously that the price only goes up. It looks like the second is a consequence of the first but at this point I'm not sure. It seems that the Ethereum network is moving in the most bullish way possible for the ETH token, so the price would influence the design of the infra (let that shit burn). Anyway, the simpler the ideas, the better they will strike the human imagination and create a cult.

Up only foundation
The up only foundation is not usurped. ETH price bottomed on October 20, 2015 at around $0.43 or $51m FDV. This level has never been retested. So, the only investors who experienced ETH as an asset that wasn't going up were those who bought on the listing day and sold it before the price made a new ATH. We are talking about the first six months of ETH price life. Then le up only, strongly. So yes, basically anyone still here will still be able to internally grumble about how they could have bought lower. This jumped out at me when I looked at the 2019 price around $10B FDV and it looked like it was 10 years ago, another era when I was far from crypto. But no, that was just 4 years ago.
When did this main trend really become incontestable?
I won't talk about anything technical. Obviously, the ETH tech improved a lot until today and adoption metrics are up only which is what really matters. But fresh fiat inflows impacted the up only foundation so I researched the historical events of institutional adoption.
The first main event in that regard was the Enterprise Ethereum Alliance (EEA) that launched on Feb 28, 2017. Basically the biggest corporations recognizing publicly that Ethereum will be the layer of their reinvented financial system. ETH was trading around $15 this day and close 2017 at $740. This was the first crack of the starter gun for the big players.
The thing is, Bitcoin is an insoluble problem for them. They can't easily build anything on it, they can't take it, they can't acquire it without giving it too much power, they can't control it. It's just not designed for them. All they can do is pray that it will increase the transition to renewable energy. At least on Ethereum they can build things that they can control so it fits their narratives better.
So Bitcoin futures CME were launched in December 2017. While ETH futures CME contracts were issued only on Feb 9, 2021. Bitcoin topped the day of its CME futures launch then start a serious downtrend. Funnily enough ETH rallied consecutively to this event, people probably realizing they need more exposure to the last standing asset that isn’t under too much big corporate power influence. Institutionals definitely opened the gates in 2017.

Then ETH joined Bitcoin in a crash that lasted all of 2018. My theory is that it was a big short on BTC via the Futures CME which dragged down ETH at the same time. I think their goal wasn’t to destroy BTC as it was already too mature to die but it was just an easy trade for institutionals as the coins were too parabolic. Also, the idea to dump on the pleb and make believers questioning themselves was seductive (to buy lower).
Wick to wick, from January to December 2018 and from ATH to bottom, ETH was down 94%. From 1440$ to 82$ or from $173B to $9.7B FDV. BTC nuked 84%, from $20k to $3.1k, ie from $420B to $65B FDV. It also explained why these digital assets and ETH in particular have pristine main trends that have nothing to do with a supercycle.
Little parenthesis here, just imagine if this was your fav alt, down 94% from ATH then bounced 59x in the next two years. The bagholder’s wildest dream. Some altcoins have done this rare thing in a shorter time this year, but you would have had to get into $PEPE very early and $BITCOIN early to witness this happening yourself, all with very little liquidity in their pools initially of course. It's the ETH casino but a casino that could be rigged with the right network, the right meme coin framework and some luck. S/o to those who caught this wave early.
Since the crash of 2018, ETH has never been pushed positively by institutionals and was just there to build. BTC was at the center of all the institutional narratives probably due to its divergent nature whose paradox reinforced by adoption is attractive (BTC not scaling, still savage and yet stronger). This partly explains why ETH/BTC rose in prominence as BTC was increasingly viewed as a crowded trade and ETH as more than a beta play.
Therefore distinct phases define ETH institutional adoption : EEA for the inception, ETH futures CME for the accessibility, and now institutionals are seeking spot ETH ETFs and staked spot ETH ETFs (Canadian 3IQ spot ETH ETF eg) for efficiency and productivity.
ETH over BTC
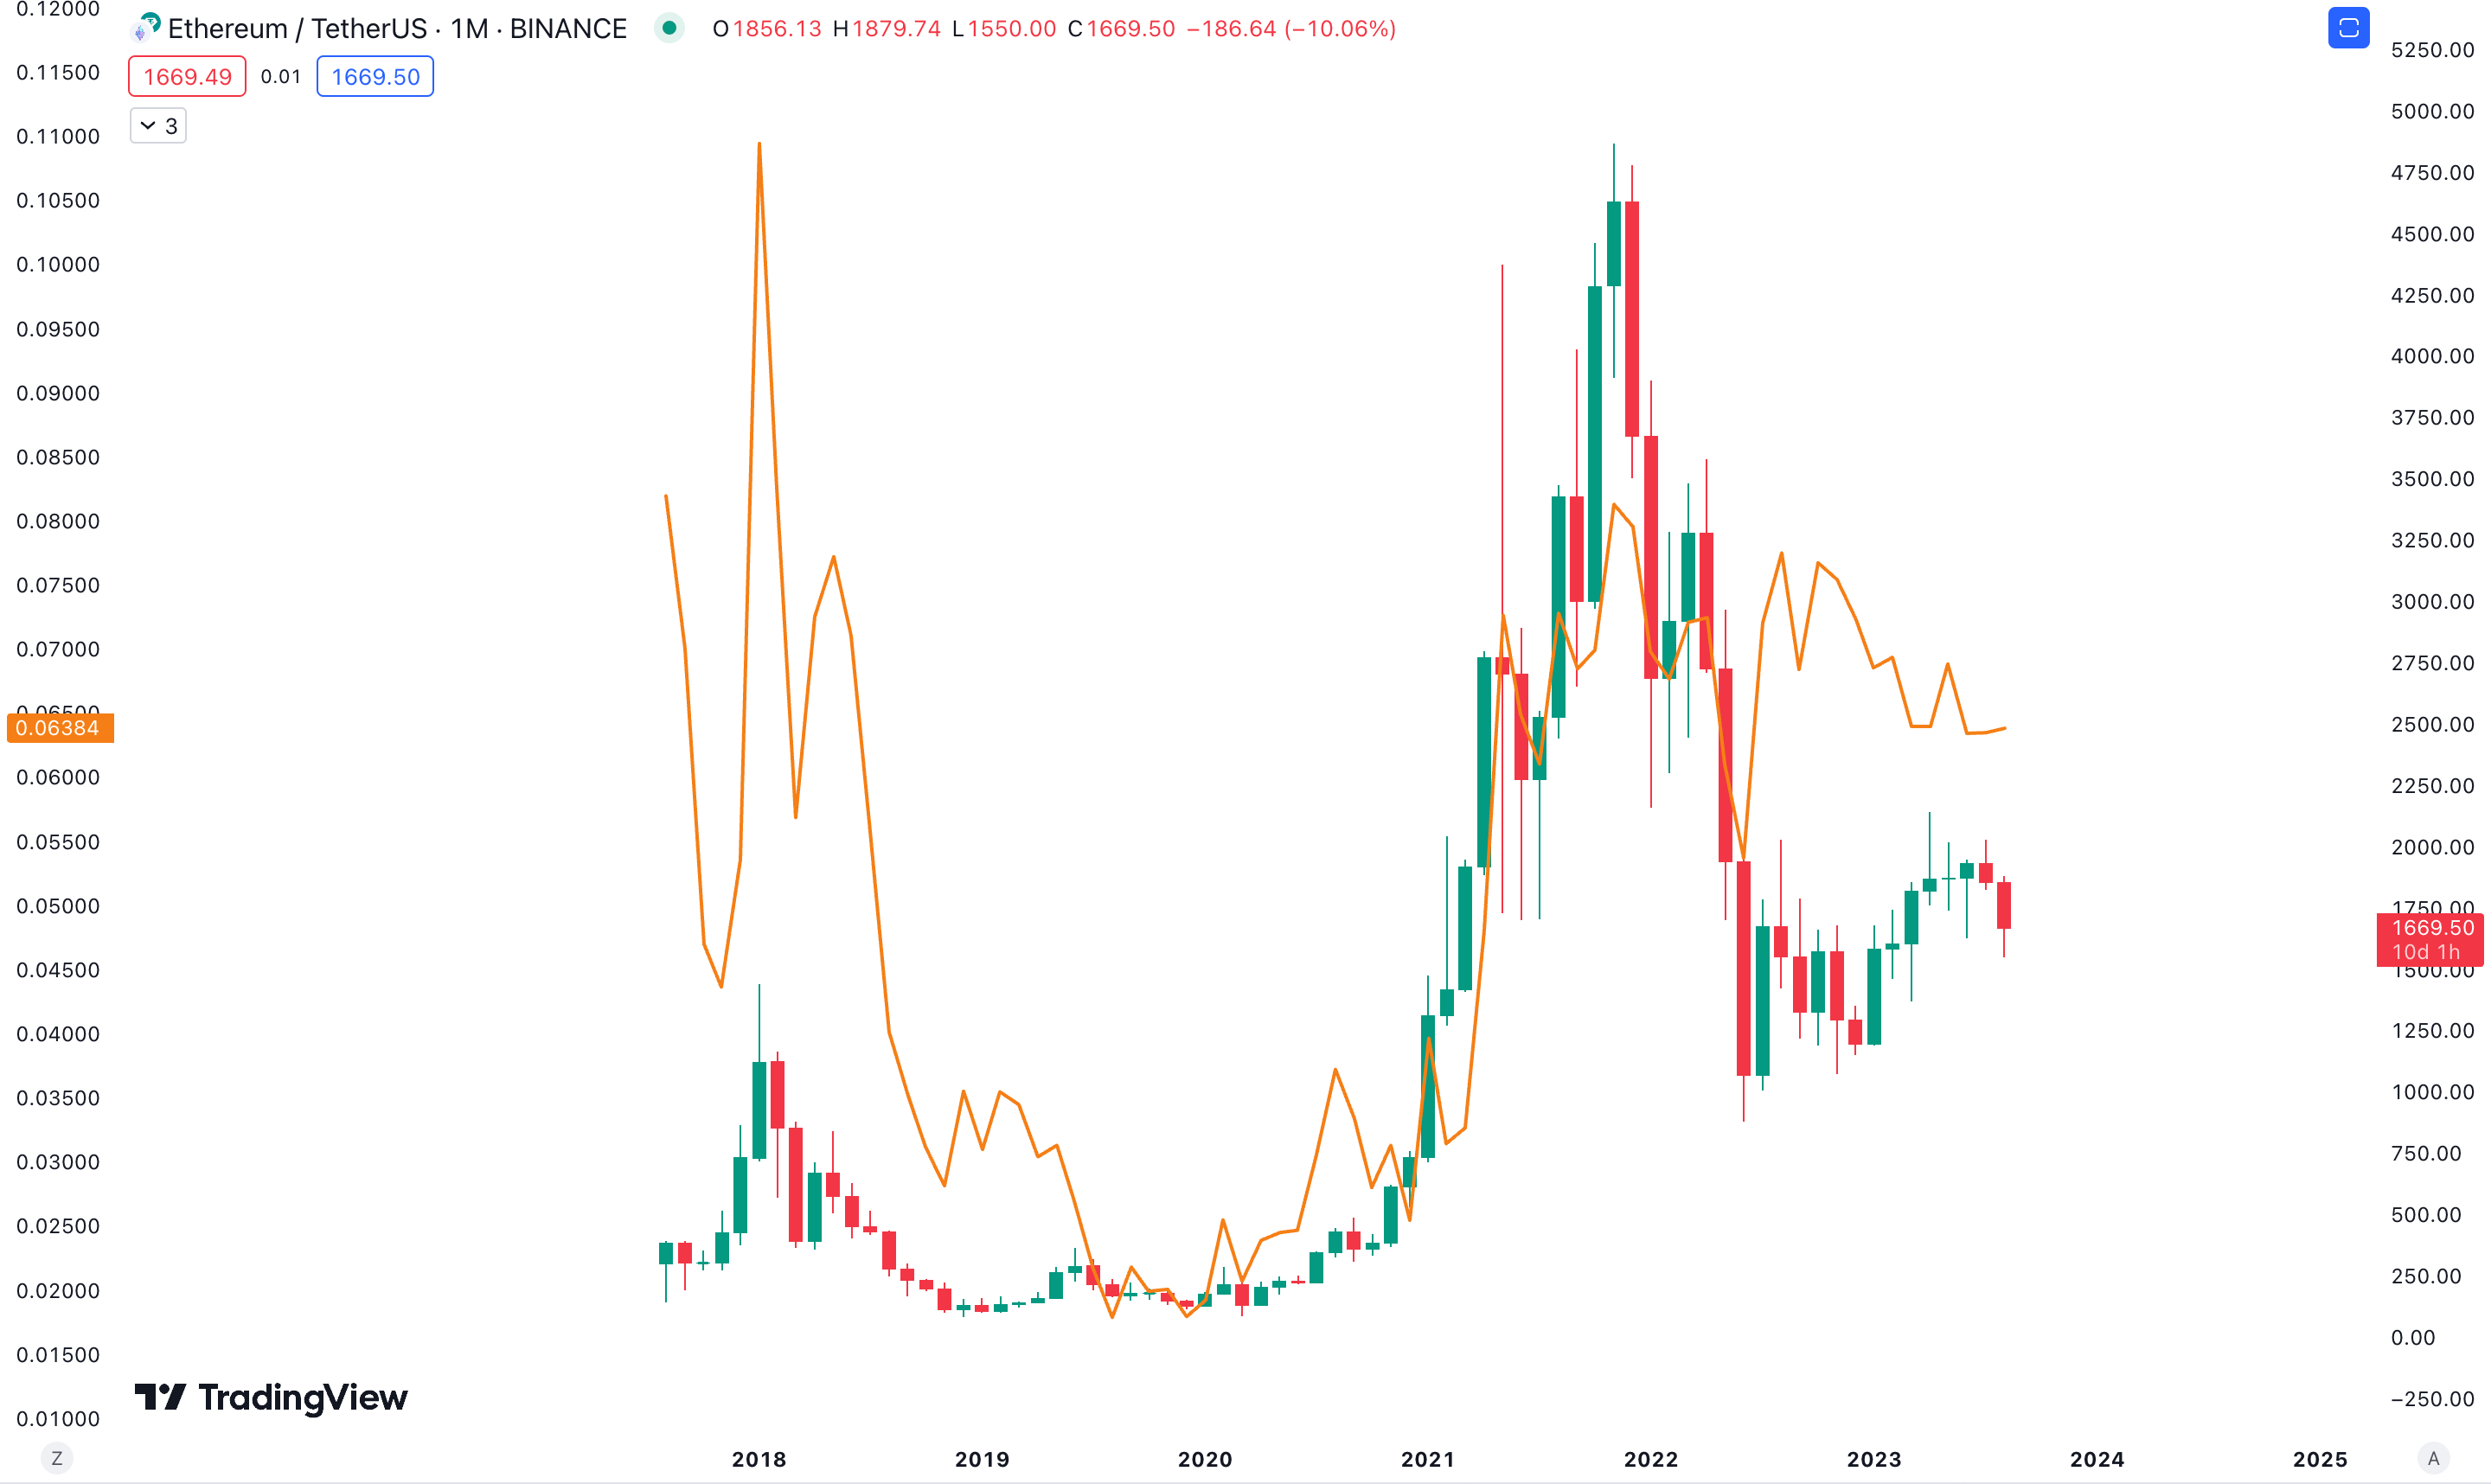
ETH/BTC is in an uptrend since the start of 2020. You can't make this up. At the current valuations of both assets and with little new capital entering the system, it is evident that portfolios are constantly being rebalanced in favor of ETH. This is not entirely bullish for the market, because ideally this ratio should increase (or at least stagnate) with ETH and BTC going up together and it’s not really the case.
You want your leader to increase the size of the pie as much as possible before he stepping down from the throne. As the chart shows, this combination of events haven’t happened since the end of the bull run in 2021. This mix implies that the stablecoin supply is invested in BTC and ETH, but more in ETH than in BTC. The chart tells us that January 2023 was one of those rare times with the pump, March likewise with USDC fud.
Over the past two months, the ratio has remained very flat with volatility gone while the price of ETH is down, implying that ETH is being sold against other cryptos than BTC (kidding) or more likely against stablecoins. This is more bearish than if the ratio fell with ETH price, as this would not imply a flight away from volatile assets but a flight into the safer BTC. I don't see this ratio breaking its next resistance until a real Ethereum-exclusive bullish news is announced. The crab market should extend until the end of the year.

Anyway, with Ethereum asserting its value proposition, there's no reason it shouldn't continue to dominate over Bitcoin in people's minds (not yours bitcoin maximalists). Therefore, outperform Bitcoin. And in truth, being the infrastructure of a new financial system accessible to almost all of the humanity is more valuable than being the store of value for a smaller part of humanity. Simply due to the utility and activity that ETH can bring, allowing it to grow faster over the years.
Part of Ethereum's success is making as many people as possible happy (rich) through the success of its altcoins or its altcoins with pictures. I think that is an very important point. What I mean is you won't get rich buying bitcoin now but you still got upside, on the other hand you probably can't get rich buying Ethereum either, but you can get rich using it.
The tech foundation of the main trend is preserved triggering the reinforcement of the up-only foundation. I don't see why that would change in the years to come. It sounds simplistic but it is as simple as that. The simulation can run.

If something were to change structurally, the chart would express it by exposing ETH trading below $1000 in my opinion. If you don't read between the lines, what I mean is that Tether and Binance fud are not sufficient events to drive the price below $1000 consistently on the monthly timeframe. Binance have real chances of not collapsing and tether will never experience enough redemptions to know if the stablecoin is really 100% backed by liquid and low-risk assets (the two events are linked, binance being the main holder of the USDT). I also don't think an audit report from Tether or Binance settling some cases would teleport ETH price.
The most problematic consequence stemming from their worries is that as the main on-ramp platforms to the crypto market, they curb the entry of fresh and big money. How to go significantely up without that money?
Otherwise, the USDC fud is barely noticeable on the monthly chart, the March candle is green and strong. Not really the picture of an ecosystem on the verge of collapse because of that. Where is even the USDT fud?
Same story for Binance vs DOJ (May 2023), Binance vs CFTC (March 2023), Binance vs SEC and Coinbase vs SEC (June 2023). All of these events happened recently but it's hard to locate them on the monthly chart for someone who doesn't know when they happened in 2023.
What worse can happen after all the madness and the desperation the market has survived from 2022 until today? This is what the chart is asking you and its own answer appears to be nothing but a malfunction in the ETH consensus or a flaw in the code after EIP 4844 upgrade. Therefore I can’t see ETH falling below $1000 in the next few months (we should never say never).
Why dump?
So, why are are dumping now? Interesting question. Over leverage would be the simple answer, but I’ll quote a famous cat here.

How I understand cat is that if the price isn’t at ATH or ATL, the price can basically do whatever it wants. Since the 2022 bottom, I will say that it can do whatever it wants between 1000$ and its ATH which is a big change.
The macro larpor will show you this and he makes a point.

The recent acceleration of US2Y-US10Y clearly does not put us in the starting blocks to break through resistance. ETH must overcome the macro or manifest the dovish Powell. How to manifest him is out of my skill set, all I understood through the Powell’s press conferences (watched way too many) is that the Fed is really looking at lagging indicators (that's a feature not a bug), so it will probably raise rates too much for our liking. As of now no rate hike is expected at the September 19 meeting so the market needs to do something in anticipation of that event.
The chart points that the recent pauses have been historically bullish for the ETH price. A drop in the inflation rate a few days before the Fed's decision would set the stage for a retest of the $2000 highs in the next two months. Don’t forget that the correlations with treasuries yield and the DXY aren’t set in stone and grow stronger when there is a lack of concrete narratives.
I note that when the market anticipated the first cut in the interest rate by the Fed in years (US2Y top), ETH accelerated its fall into oblivion in 2019. Something similar is scheduled when the Fed implies an end to rate hikes. How the crypto market will react to the opportunity of “buying the bottom” of US2Y-US10Y T-Bills? Different from 2019 for sure, or ETH won't have progressed much beyond speculation.
Who dumped on you?
If you want to know why the price dumped, just ask yourself who dumped on you. Digging on-chain analysis isn't helpful in this case, researching the majors inflows to exchanges even less, sorry. No one with the tools to influence market prices will execute on-chain.
Coinbase and Binance hold the majority of the liquidity that can influence the price. I'm talking about accounts on these exchanges that never venture on-chain. They deposit fiat funds, trade them exclusively on the stock exchange, which keeps them safe and guarantees their availability. Deposited funds are simply liabilities of customers in the balance sheets of these exchanges. Coinbase said it held $128B in digital assets at one point in its Q2 2023 earnings report. That's crazy when you compare that to CB's on-chain wallets.
Therefore some whales funds held on exchanges are not reflected in an increase in stablecoins’ supply so they aren’t quantifiable on-chain. Don't trust verify is not applicable under these conditions.
So I don’t know of a way to assess inflows of fresh fiat into these exchanges and therefore into the ecosystem which could lead to an unforeseen pump, nor the flight of capital from these exchanges outside the crypto eco for a unforeseen dump.
But watching stablecoin supply inflows and outflows can be interesting. One would think parodically that at some point if every binance user attempts to exit the exchange, Binance will have to redeem stablecoins to give them their fiat money.
In the other direction, if massive fiat inflows enter the system, the reserves of binance or coinbase couldn’t be depreciated for too long, so the minting of stablecoins will happen quickly and could be correlated with price action.
Influx of new money must be observable through the outflows of Tether’s and Circle’s treasury/multisig addresses to Binance and Coinbase. You can monitor outflows to other entities but with size these will likely be market makers or bitfinex ops. The outflows must be significant, over $1B over a monthly period for example. Remember that the USDT supply is $82B and the USDC supply is 25$ billion. $1B barely represents 1% of the combined supply. Many on-chain data platforms facilitate access to this information relatively easily.
The sloth is sick of endlessly editing sentences and so won’t be able to develop and draw conclusions about stablecoins flows. But this will be pursue in another article.
le up
So to wrap up, on the monthly timeframe the price is in a hot spot heading into September, as if being held hostage in limbos by voices in its head (hey Mal). Besides the pullback to validate, the 0.618 Fibonacci retracement of the yearly impulse matters now that the local low was reached at this precise level at $1560. The 0.5 fibb is sitting with the ex-bear resistance at $1680. These levels are therefore to be followed for the coming months (defend 0.618 and reclaim 0.5 on the monthly). Hopefully fud which like to go all out in these scenarii don't get too inspired but it should be alright.
However, I repeat myself but I think that ETH will break $2100 by the end of the year to try $3300 in Q1 2024 unless the new support stamped by market participants at $120-130B FDV is broken before (black swan).
Ask yourself what could break the support, I can’t see nothing. Ask yourself what could break the $2100 resistance, my guess is that flip the current one into support might be enough.
The real question is above all how to break the current ATH? Fed printer might not be enough this time. Or Follow BTC closely in hopes of anticipated ETF pricing and then benefit from a “sell the news” event through an ETH/BTC breakout? It might not be enough. What then? I don't know right now but I'm sure we'll find out in due time.

I almost forgot, I liked the launch of the ETH/BTC futures CME in late July (there is close to 0$ OI/volume for now). Two questions that tend to be answered in the affirmative come to mind.
Will the new favorite institutional crypto trade soon be long ETH/BTC? Is this the beginning of a new paradigm for the big money or simply the signal to short ETH until spot BTC ETFs?
Without transition, I think this is one of the first things I write also for myself so as not to forget what is important about ETH.
Not a financial advice.